One Arizona county is showing what GIS can do for elections

Fourteen years after it started using geospatial information systems to draw its election maps, Maricopa County, Arizona — home to more than half the state’s population and the fourth-biggest county in the nation — says there have been marked improvements in the accuracy of precinct and legislative district boundaries, as well as participation and confidence from voters.
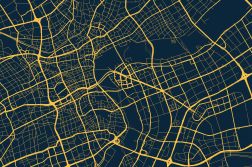
Maricopa’s achievements were summarized in a report Monday distributed by the National States Geographic Information Council highlighting the usefulness of GIS in election administration. The report was part of the Geo-Enabled Elections Project, a NSGIC initiative aimed at encouraging election officials to use more-precise mapping technology in figuring out where voters go to cast their ballots and which races they vote in, rather than a decades-old standard in which precinct and district lines are determined by written descriptions of physical characteristics of a geographic area.
After they embraced GIS in 2006, Maricopa election officials found it much easier to manage their tabular files of voter registrations than under the old system, known as metes and bounds. The switch also came at a time when Maricopa, which includes Phoenix and today counts more than 2.4 million active voters, was growing in population too quickly for the metes and bounds method to keep up.
“The county was growing so rapidly, it only made sense to move to a GIS system to ensure voters were assigned to the correct districts,” reads the report, which was written by Gary Bilotta, the director of IT and GIS for the Maricopa County recorder’s office.
Getting voters the right ballot
Moving to a GIS-based approach also made it easier for officials to verify voters’ addresses, accelerated the redistricting process and helped mapmakers avoid splitting multi-unit dwellings, such as apartment buildings or trailer parks, across legislative or congressional districts.
NSGIC and other proponents of GIS in election administration say that using modern mapping technology can reduce or even eliminate the possibility that a voter is sent to the wrong polling place or receive the wrong ballot, mistakes that could throw the results of a race. A frequently cited example is a 2017 Virginia statehouse race that was settled with a name being drawn from a bowl after a recount ended in a tie, only for officials to reveal later that 26 voters who cast ballots in that contest should’ve been apportioned into a neighboring district.
“At the most fundamental level, GIS ensures voters get the right ballot,” said Tammy Patrick, who was the federal compliance officer for the Maricopa County Elections Department when the recorder’s office started using GIS. “Voters being placed in the wrong district [happens] when it’s done manually.”
Patrick said implementing GIS also enabled Maricopa residents to give more input in how their voting lines are drawn. After the 2010 census, Maricopa County launched an online tool residents could use to draw their own boundaries and see demographic and party-registration statistics of their proposed districts. She said this tool was particularly useful when it came time for Arizona to submit its decennial redistricting plan to the Justice Department in accordance with the the 1965 Voting Rights Act. (The section of the VRA that required Arizona and eight other states to get federal approval for changes to election laws and maps was later invalidated by a 2013 Supreme Court decision.)
But Maricopa County may have been ahead of its time, said Patrick, who’s now a senior adviser at the Democracy Fund.
“When we submitted to the DOJ, they said we can’t use shape files,” she said. “We need these as legal descriptions. One of the things that’s ironic and little depressing, back in 2006 when Maricopa was undertaking, we all thought we were behind the game. It turned out we were the frontrunner jurisdictions.”
‘A lot on their plate’
Ten years on, with another census being conducted, GIS use in election administration has grown, but it’s still far from universal, especially at the county and municipal levels where precinct maps are drawn.
“We will have more states and localities using it this time around,” Patrick said. “But we still have a long way to go.”
Still, GIS is expected to get a boost this summer when eight more states, including Arizona, get added to an interactive mapping tool designed to help officials figure out the best locations for polling places and absentee ballot drop-off locations. The tool, made by the University of Southern California’s Center for Inclusive Democracy, had been used in previous years by California and recently expanded to Colorado.
Patrick said the Voting Location Siting Tool could be crucial as election officials respond to the COVID-19 pandemic by greatly expanding the availability of voting by mail, particularly in states where that’s not the norm. (Maricopa County is, in fact, one of the biggest vote-by-mail jurisdictions, with about 75 percent of voters enrolled in a permanent absentee ballot program.) The siting tool, Patrick said, gives officials in the included states the ability to locate new polling places and spots for ballot drop-offs.
“Every jurisdiction is going to find some errors that need to be remedied,” she said. “Sometimes it’s because rivers don’t flow in the same riverbed. We’ve found in places where even the state line is wrong. Election officials have a lot on their plate. We expect them to be cybersecurity experts, IT experts, and now also geospatial sophisticates.”
